


You'll almost never hear us say a bad word about cohort analysis, but if you pressed us to make a complaint, we might say this - even though cohort analysis is essential in determining which factors correlate with higher customer lifetime value, the actual process of comparing multiple factors can get clunky.
Everything's breezy when the only difference between cohorts is the first order date. All the data fits in one table and segments are easily compared.
But when you want to compare customers that vary on characteristics like first order product, marketing channel, discount code, or any of the other attributes that you can filter for in the LTV report? That's when things get tricky. Until now, the only way to properly segment customers by these characteristics has been to run multiple LTV reports with different filters applied, then either record the results or compare them across multiple tabs.
We built the new Compare Cohorts tool to make this process easier. Instead of running multiple LTV reports, you can quickly segment customers by different attributes and then track and compare their LTVs within a single table.
The metrics won't match exactly with the LTV figures you see in the averages row in a normal report (we'll explain why below), but it's a great first step in discovering meaningful differences in customer behavior.
Let's look at an example. Say that you're expanding your product line and want to know 1) which product categories correlate with higher LTVs, and 2) which individual products have the highest LTVs when ordered first.
To start, open the LTV report, click the checkbox next to the word "Compare", select "First order product type", and then click "+ Add cohort" in the top left of the blank report. Then one by one, you can add whichever product type you want to compare.
.gif)
To keep it simple, we'll just look at three product types in our demo store: Health Boost, Essentials, and All Natural. We'll keep the time period of the report at the last six months and the metric as accumulated sales per customer, though these can be changed as if we were running a standard LTV report.
Here are the results:

We can see right away that customers have significantly higher LTVs six months after their first orders when either an Essentials product ($96 six-month average LTV) or an All Natural product ($99 six-month average LTV) is ordered first, with Health Boost products far behind. Without this new compare feature, we would have had to run three separate LTV reports with the correct filters applied to get this result.
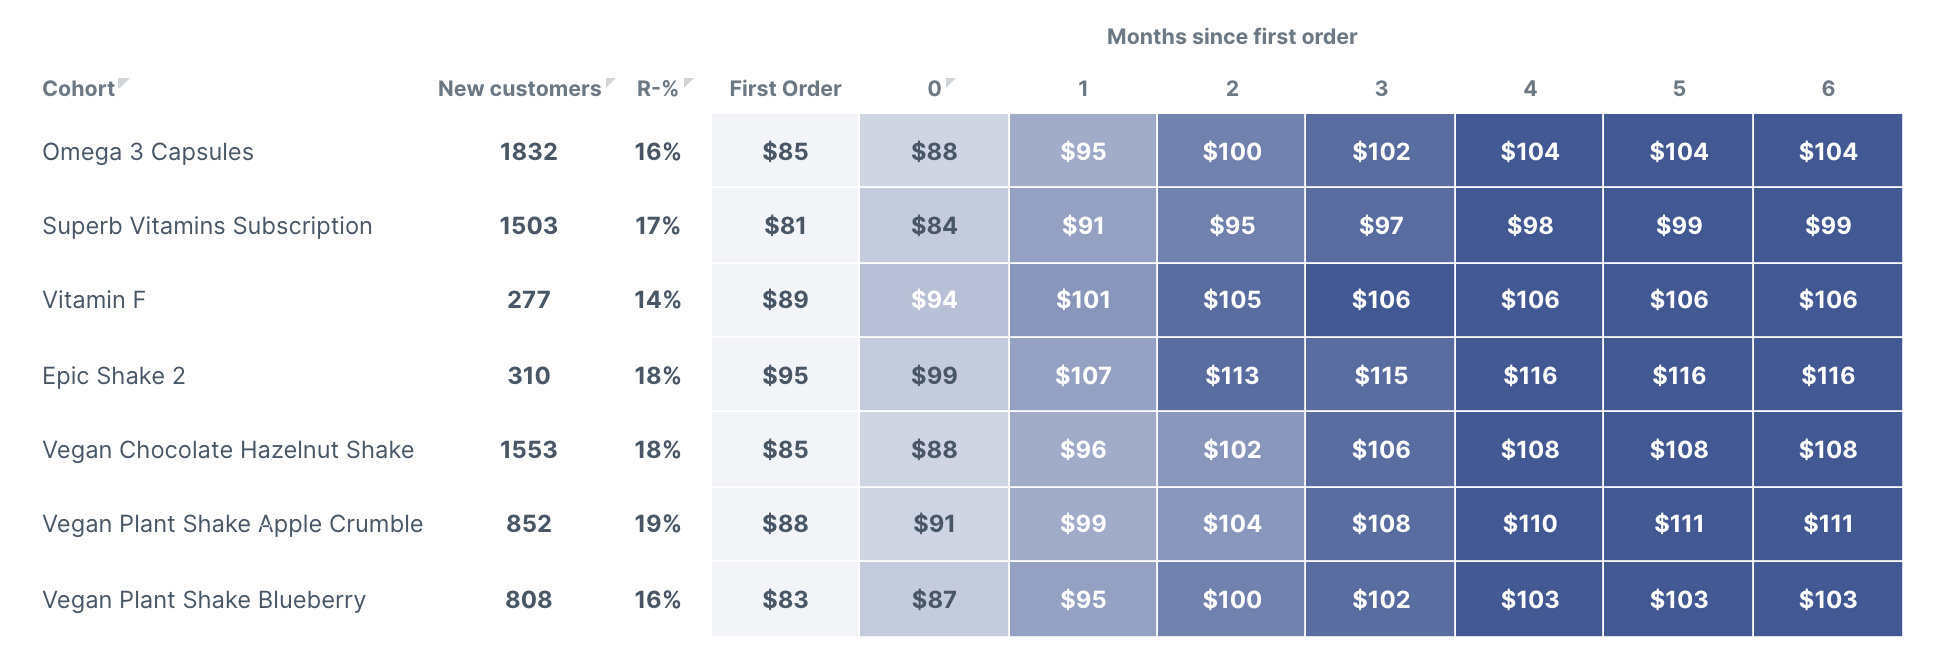
Now let's analyze which products within these top two categories correlate with higher LTVs. Since we're comparing a new characteristic, we'll need a new report. To do that, we'll select "First order product" from the Compare drop-down menu. Now when we click the "+ Add cohort", we'll be able to choose which products from our line to compare.
For this example, I just cherry-picked 3-4 of the top selling products from each category, though I could have added as many products as I wanted to compare.
Here are the results:

The data here shows that the "epic" shake and vegan shakes led to the highest 6-month average LTVs when ordered first. And again, we're getting this result much faster than if we had been forced to run seven separate LTV reports to compare across products.
Of course, this is only part of the full picture, and you would want to look into other factors before deciding on new products to develop. But when your goal is to make quick comparisons between different customer segments without having to run excessive numbers of reports, the Compare view will be especially useful.
In theory, the LTV figures in the Compare view should match the LTV figures in the "Averages" row of a standard report. In the example above, you would expect an LTV report filtered for the Essentials product type to show a $96 six-month average LTV.
However, the standard LTV averages calculation e.g. six months after first orders only includes customers whose first orders were at least six months ago, whereas the Compare view's calculations simply sum up each cohort's accumulated sales after six months and divides by the total number of customers in the cohort.
In practice, the inclusion of newer customers means the LTV values are lower in the Compare view, but the figures are still fully capable of helping make comparisons.
The next update to the Compare Cohorts feature will include spaghetti chart functionality and the ability to compare your saved cohorts. If you have any other suggestions on how else to improve the Compare view, let us know at hello@lifetimely.io!